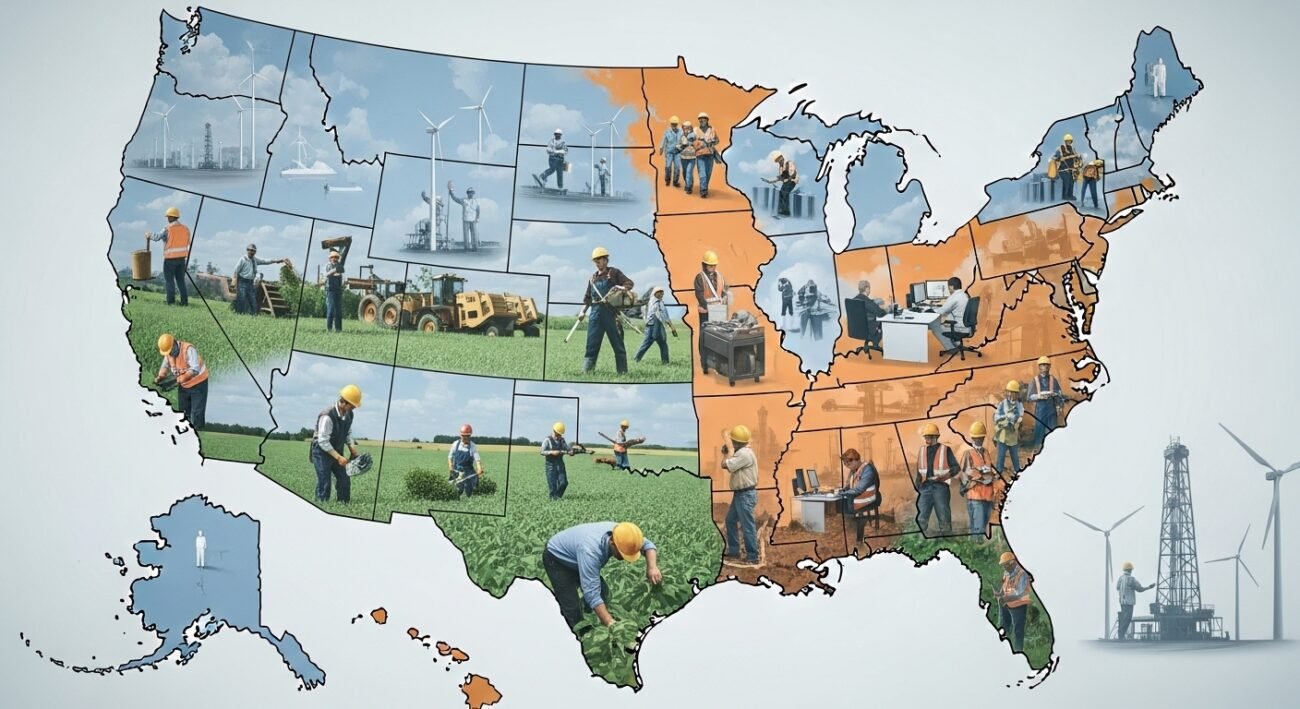
Across the United States, work habits vary widely from region to region, shaped by industry demands, cultural expectations, and economic opportunity. Some states consistently log longer hours and maintain higher labor force participation, while others show lighter average workloads and shorter workweeks. Using widely reported labor metrics such as average hours worked, employment rates, and workforce engagement, certain states regularly stand out at both ends of the spectrum.
North Dakota Sets the Pace for Work Ethic

North Dakota frequently ranks at the top for work intensity, supported by high labor force participation and long average workweeks driven by agriculture and energy production. A culture rooted in resilience and community responsibility reinforces a steady commitment to full-time employment across both urban and rural areas.
Alaska Reflects Long Hours in Demanding Industries

Alaska’s workforce often records extended hours, largely due to energy, fishing, and transportation sectors that require sustained physical effort in challenging conditions. Seasonal demands and remote geography also contribute to longer average shifts and a strong reliance on full-time labor participation.
South Dakota Maintains Strong Workforce Engagement

South Dakota consistently demonstrates high employment rates and solid participation in the labor force, particularly in agriculture, healthcare, and manufacturing. The state’s lower unemployment rate and steady work hours contribute to its reputation for reliability and productivity.
Nebraska Shows Consistent Employment Stability

Nebraska combines one of the nation’s lowest unemployment rates with dependable full-time work patterns across industries such as agriculture, logistics, and food processing. Workers in the state tend to maintain steady hours, reflecting both economic stability and a practical work culture.
Wyoming Relies on a Dedicated Labor Force

Wyoming’s economy depends heavily on mining, energy extraction, and ranching, sectors known for physically demanding schedules and extended hours. The state’s workforce participation reflects a strong alignment between available jobs and local labor engagement.
Texas Benefits from Broad Industry Participation
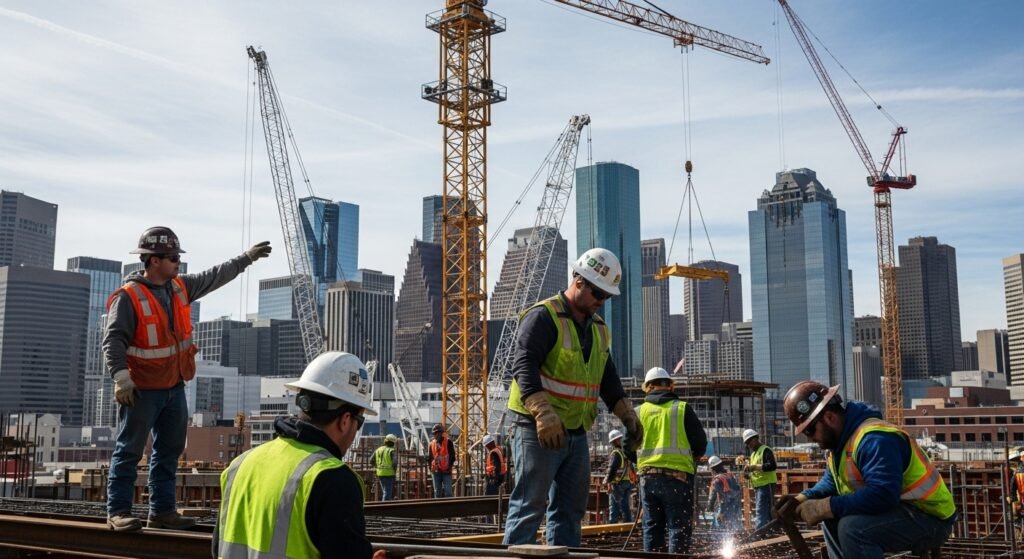
Texas stands out for both workforce size and participation, fueled by industries ranging from energy and technology to construction and healthcare. Long working hours in major metropolitan areas such as Houston and Dallas contribute to overall high labor metrics statewide.
Colorado Balances Growth with High Employment

Colorado’s expanding economy in technology, healthcare, and outdoor recreation supports strong employment numbers and consistent labor force participation. Workers often maintain full-time schedules that reflect both professional ambition and economic growth.
Utah Combines Participation and Productivity

Utah frequently reports one of the highest labor force participation rates in the country, supported by a growing technology sector and entrepreneurial environment. The state’s workforce reflects strong engagement, particularly among prime working-age residents.
New Mexico Records Shorter Average Workweeks

New Mexico often appears near the lower end of work intensity rankings, with shorter average hours and lower labor force participation compared to national leaders. Economic challenges and a higher proportion of part-time employment influence overall workforce metrics.
West Virginia Faces Ongoing Employment Barriers
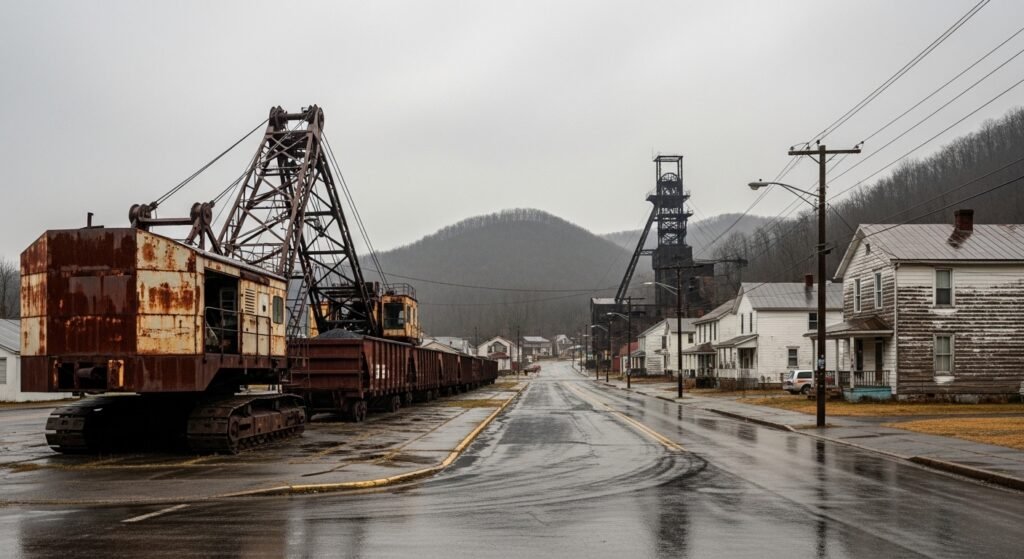
West Virginia has experienced lower participation rates and higher unemployment levels than many other states, influenced by shifts in the coal industry and rural economic limitations. These factors contribute to reduced average work hours statewide.
Mississippi Shows Lower Workforce Participation
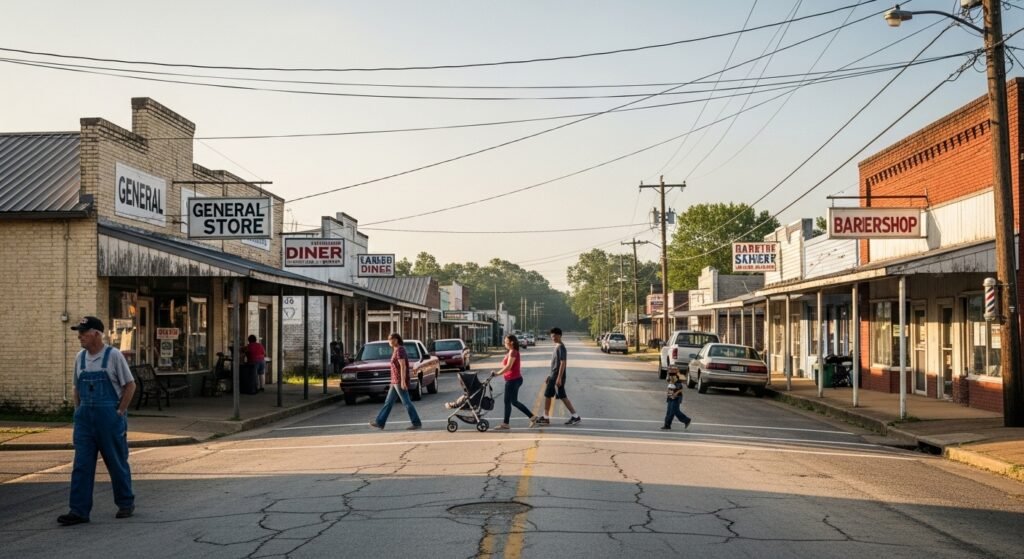
Mississippi’s labor metrics often reflect lower employment engagement, shaped by economic disparities and limited industry diversification. A smaller percentage of residents actively participating in the workforce impacts its ranking in work intensity comparisons.
Nevada Reports Fluctuating Employment Patterns

Nevada’s economy, heavily dependent on hospitality and tourism, can experience fluctuations in work hours and employment stability. Periods of slower tourism activity can reduce overall labor engagement across the state.
Arizona Reflects Mixed Employment Dynamics

Arizona demonstrates moderate employment growth but often records lower average weekly hours compared to harder-working states. A significant retiree population and part-time service roles influence workforce statistics.
Michigan Balances Manufacturing with Workforce Shifts

Michigan’s economy remains tied to manufacturing, yet changes in the automotive sector have affected labor participation levels over time. While many residents maintain full-time employment, overall engagement does not consistently reach the highest national tiers.
Alabama Experiences Slower Labor Participation Growth

Alabama maintains a steady employment base in manufacturing and agriculture, but workforce participation rates remain below the national average. Structural economic challenges contribute to fewer total hours worked across the population.
New York Shows Shorter Average Work Hours Overall

Despite its large and diverse economy, New York often reports lower average weekly work hours when measured statewide. A concentration of part-time positions and varying employment patterns outside major urban centers influence overall labor intensity figures.